Track product performance, sales trends, and revenue by product with comprehensive analytics for your product store.
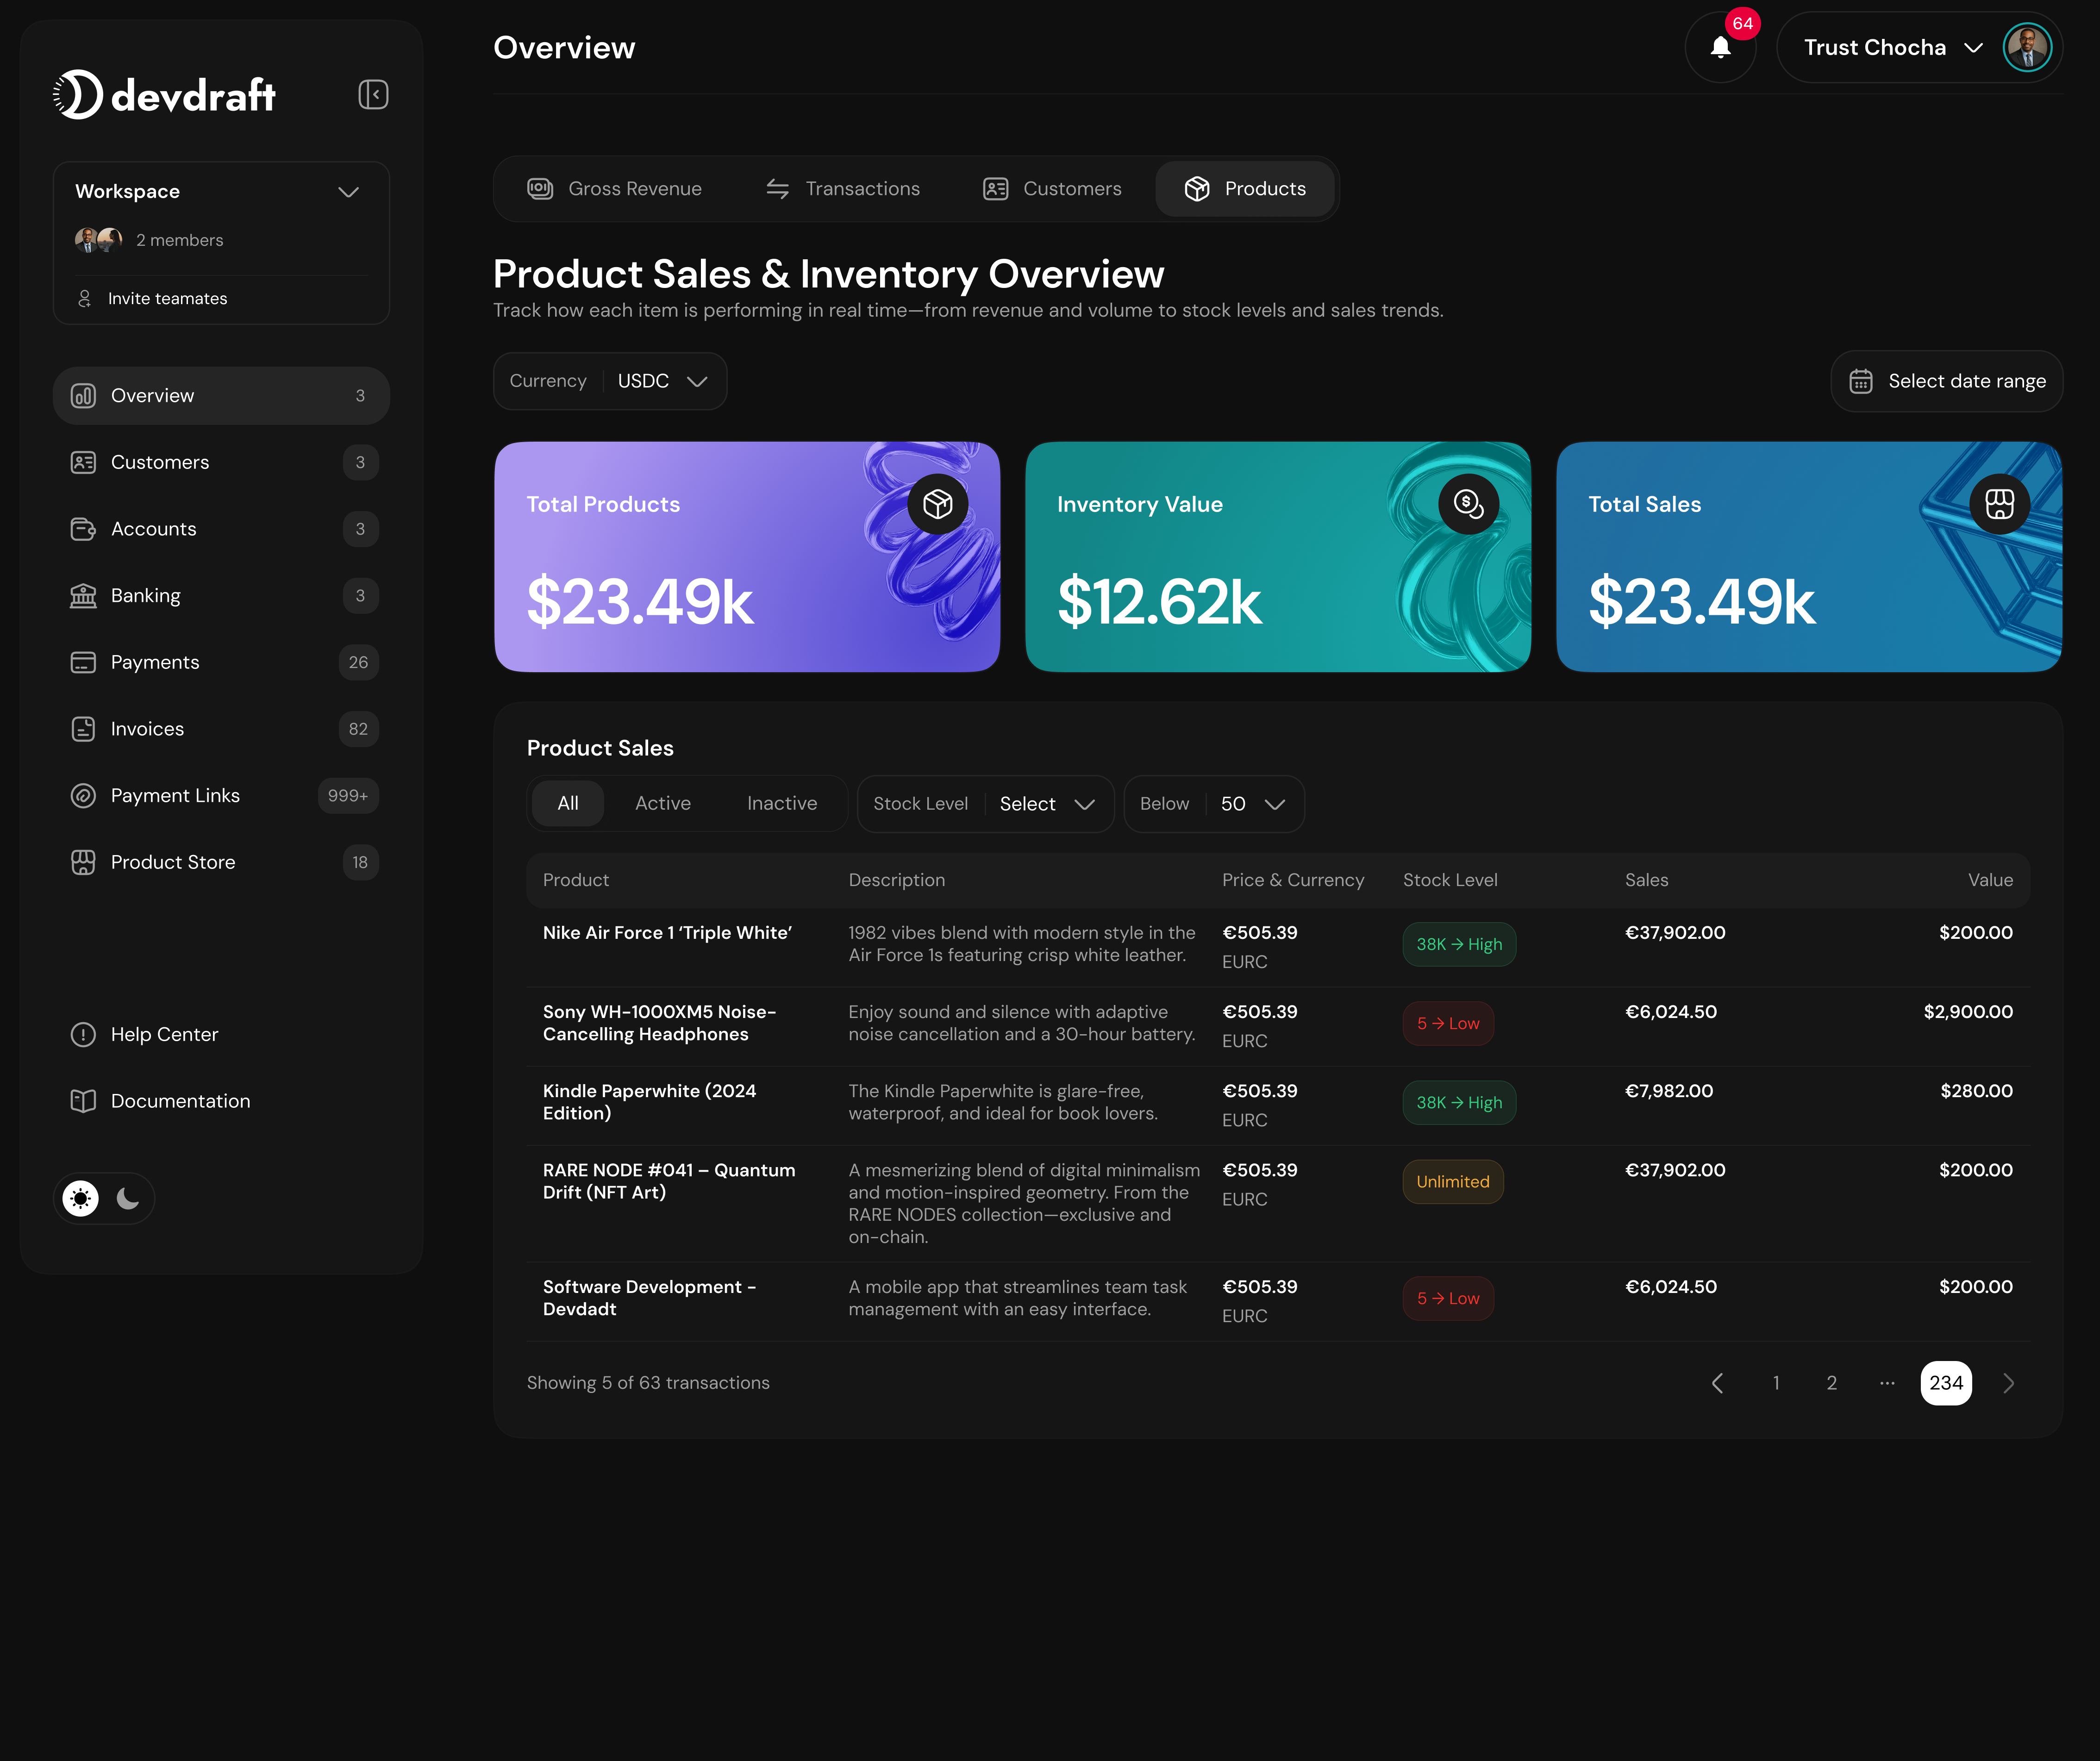
Product Metrics Dashboard
- Product Performance
- Inventory Status
- Product Analytics
Sales Performance Tracking:Key Performance Metrics: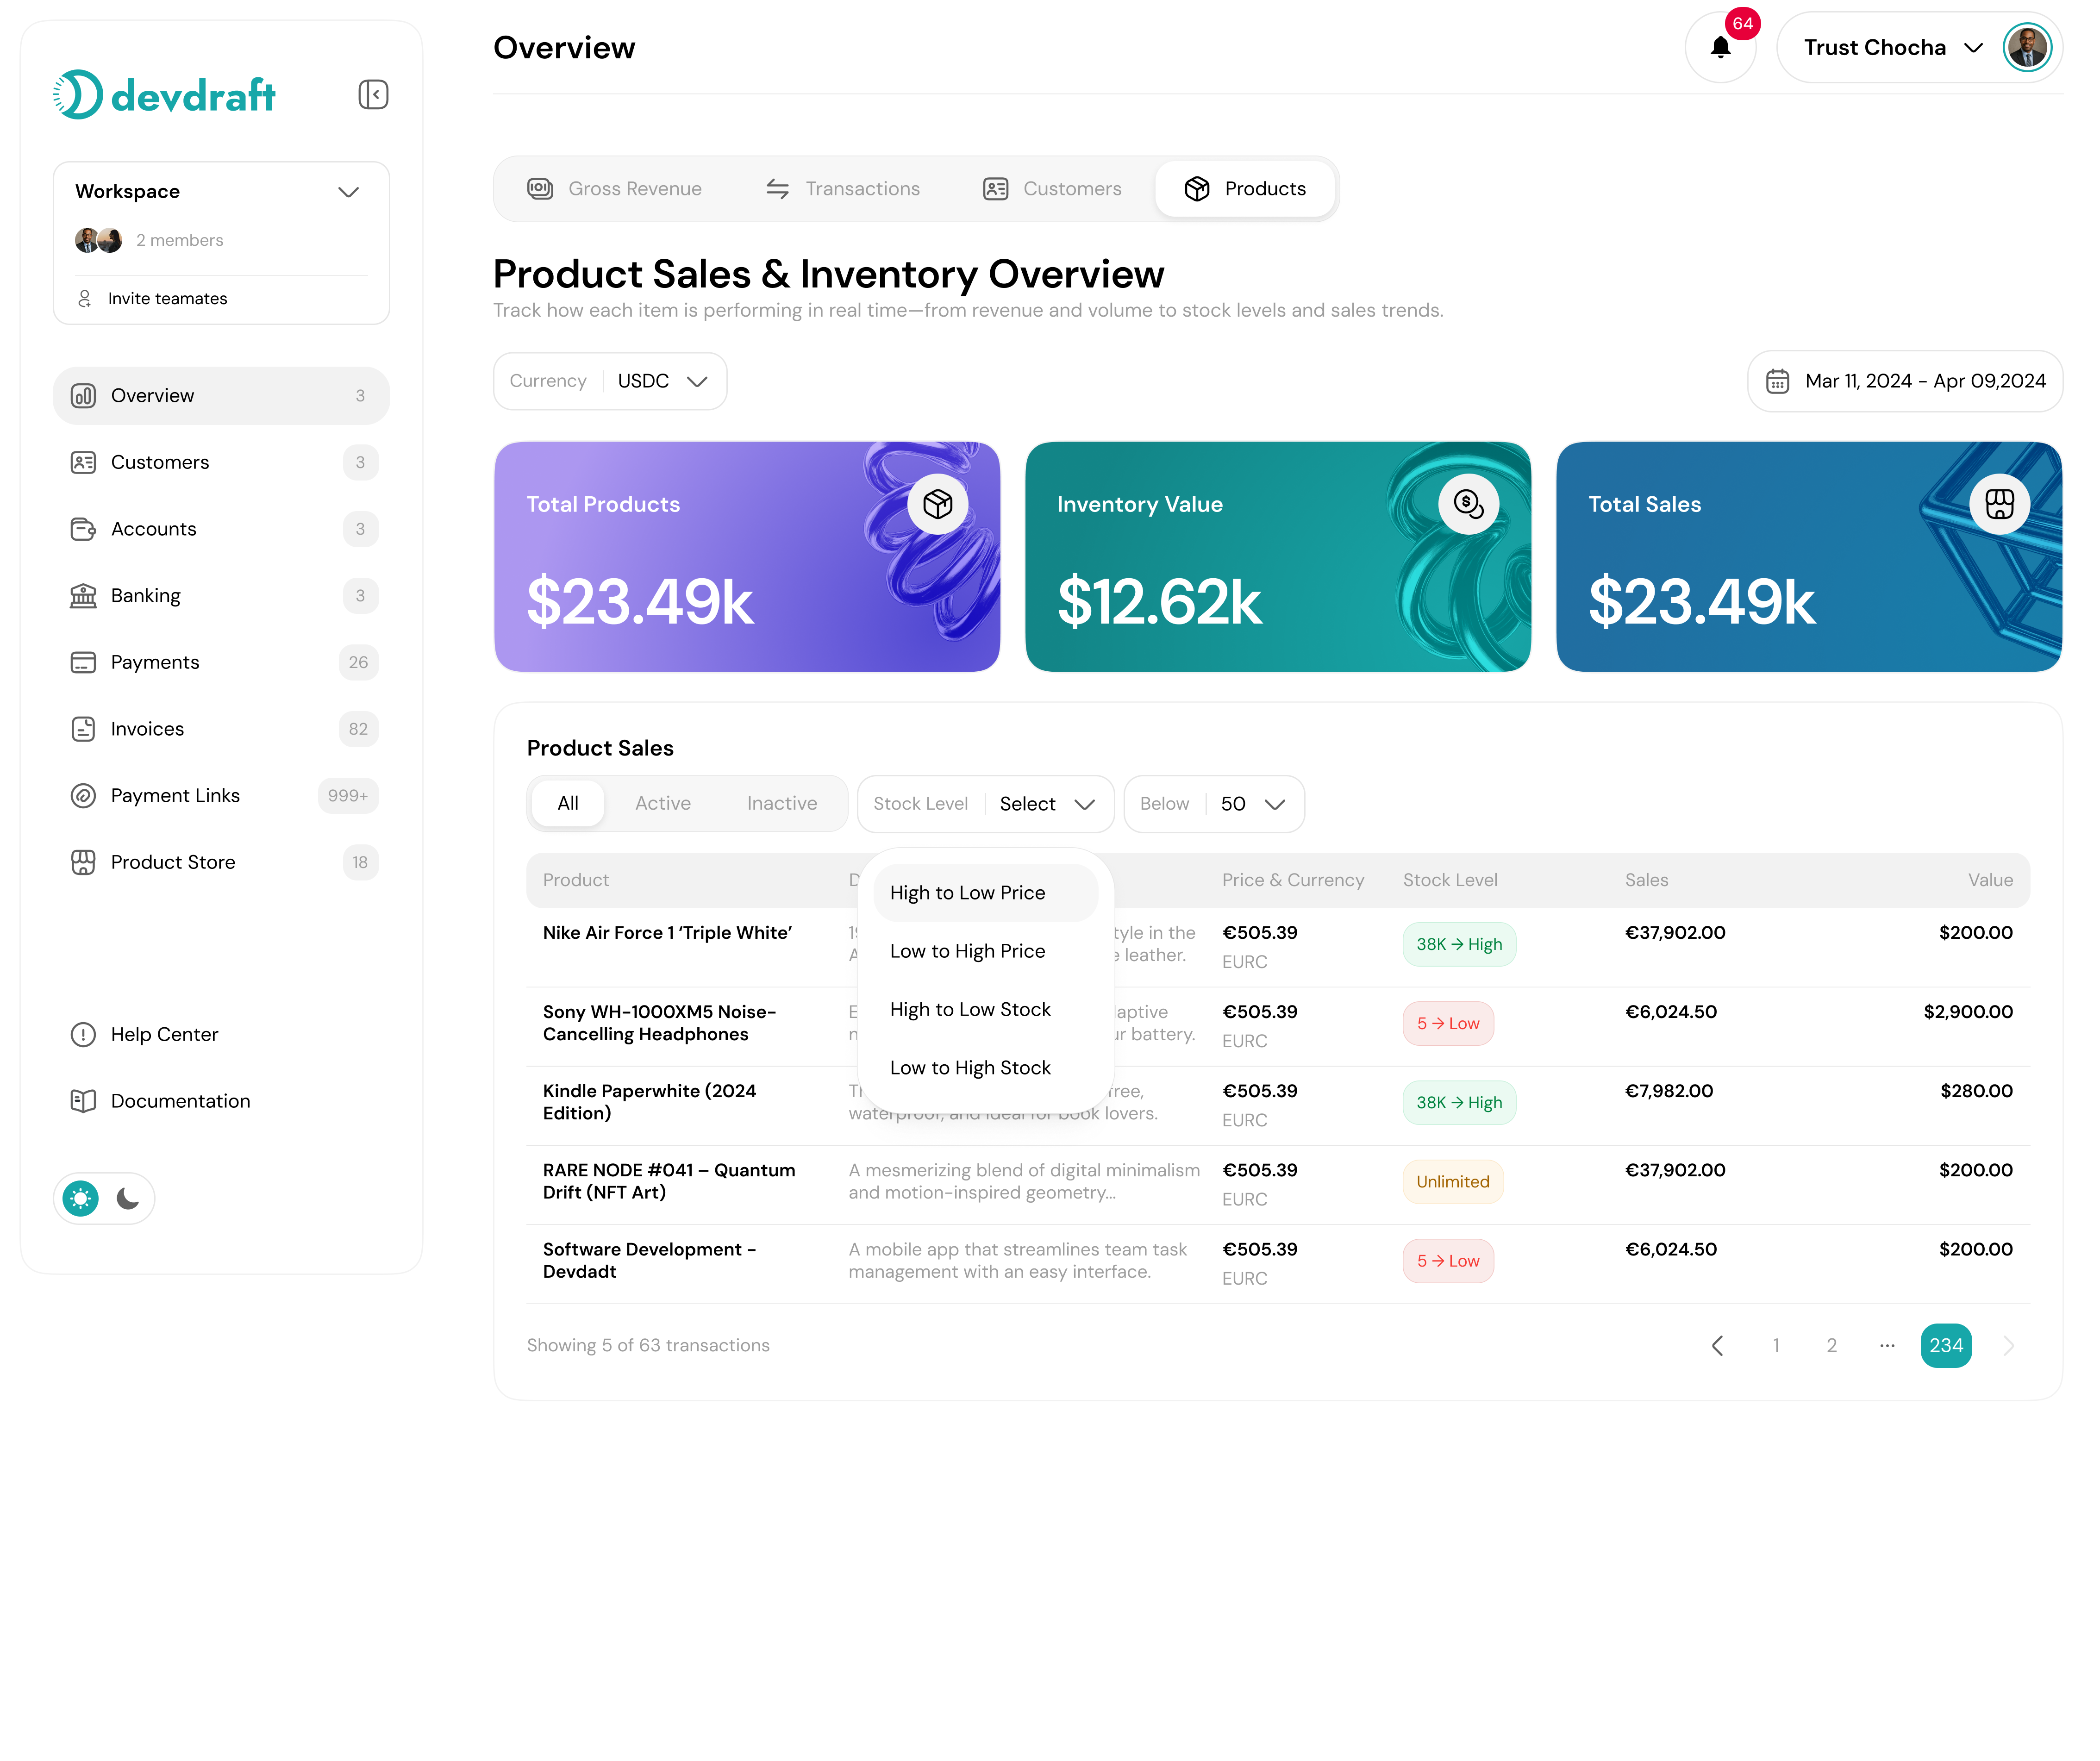
- Total Products - Complete product catalog count
- Active Products - Currently available products
- Archived Products - Inactive product listings
- Total Sales Value - Revenue from product sales
- Top-selling products
- Revenue per product
- Sales velocity by product
- Product conversion rates
Product Store Analytics Dashboard
- Product sales trends
- Seasonal performance patterns
- Price elasticity analysis
- Customer preference insights
Advanced Product Analytics
Sales Performance Analysis
Sales Performance Analysis
Comprehensive Sales Metrics:Revenue Analysis:
- Total Sales Revenue - Complete product revenue
- Average Order Value - Mean purchase amount
- Sales Growth Rate - Period-over-period growth
- Revenue per Product - Individual product contribution
- Daily sales trends
- Weekly performance cycles
- Monthly sales patterns
- Seasonal demand variations
- Best-selling products by volume
- Highest revenue-generating products
- Most profitable products
- Fastest-moving inventory
- Product preference analysis
- Customer segment preferences
- Repeat purchase patterns
- Product affinity analysis
Inventory Management
Inventory Management
Stock Control and Optimization:Inventory Levels:
- Current stock quantities
- Available vs. reserved stock
- Stock value calculations
- Inventory aging analysis
- Inventory turnover rates
- Stock velocity tracking
- Slow-moving inventory identification
- Fast-moving product analysis
- Reorder point calculations
- Lead time considerations
- Economic order quantity (EOQ)
- Safety stock requirements
- Overstock identification
- Understock risk assessment
- Optimal inventory levels
- Cost reduction opportunities
Product Lifecycle Management
Product Lifecycle Management
Product Performance Over Time:Lifecycle Stages:
- Introduction - New product launch
- Growth - Increasing sales momentum
- Maturity - Stable sales performance
- Decline - Decreasing demand
- Sales trajectory analysis
- Product adoption rates
- Market penetration metrics
- Competitive positioning
- Product promotion strategies
- Pricing optimization
- Inventory planning
- End-of-life planning
Product Table Analytics
Product Listing
Product Catalog View:
- Complete product information
- Stock levels and status
- Pricing and currency details
- Sales performance indicators
Filtering Options
Advanced Filtering:
- Filter by product status
- Stock level filtering
- Sort by performance metrics
- Search by product name
Product Filtering and Analysis
1
Select Time Range
Choose your analysis period:
- 7 Days - Recent product performance
- 30 Days - Monthly product analysis
- 90 Days - Quarterly performance review
- 1 Year - Annual product trends
- Custom Range - Specific date periods
2
Filter by Product Status
Focus on specific product categories:
- All Products - Complete product catalog
- Active Products - Currently available items
- Archived Products - Inactive product listings
- Low Stock - Products needing restocking
3
Sort by Performance
Organize products by key metrics:
- Product Name - Alphabetical sorting
- Price - Value-based sorting
- Stock Level - Inventory quantity
- Sales Performance - Revenue-based ranking
4
Export Product Data
Download product analytics:
- CSV export for detailed analysis
- Product performance reports
- Inventory status reports
- Sales analytics summaries
Stock Management Features
Stock Level Monitoring
Stock Level Monitoring
Real-Time Inventory Tracking:Stock Status Indicators:
- High Stock - Green indicator (>100 units)
- Medium Stock - Yellow indicator (20-100 units)
- Low Stock - Orange indicator (1-20 units)
- Out of Stock - Red indicator (0 units)
- Automated low stock notifications
- Out-of-stock alerts
- Reorder point triggers
- Critical inventory warnings
- Inventory movement tracking
- Stock adjustment logs
- Purchase order history
- Sales impact on inventory
Inventory Valuation
Inventory Valuation
Stock Value Calculations:Valuation Methods:
- Current stock value
- Cost basis calculations
- Market value assessments
- Inventory write-down tracking
- Inventory carrying costs
- Stock value fluctuations
- Inventory investment analysis
- Cash flow impact assessment
- Overstock cost analysis
- Understock opportunity costs
- Optimal inventory investment
- ROI on inventory decisions
Product Performance Insights
Top Performers
Best-Selling Products:
- Highest revenue products
- Most popular items
- Fastest-moving inventory
- Customer favorites
Underperformers
Low-Performance Products:
- Slow-moving inventory
- Low-revenue products
- Poor conversion rates
- Optimization candidates
Growth Opportunities
Expansion Potential:
- High-demand products
- Stock-out frequency
- Market gap identification
- Revenue growth opportunities
Data Export and Reporting
Product Reports
Product Reports
Comprehensive Product Analytics:Report Types:
- Product performance summaries
- Inventory status reports
- Sales analytics reports
- Stock movement analysis
- CSV for spreadsheet analysis
- PDF for presentation
- JSON for system integration
- Charts and visualizations
Automated Insights
Automated Insights
AI-Powered Product Intelligence:Predictive Analytics:
- Demand forecasting
- Stock optimization recommendations
- Price optimization suggestions
- Product lifecycle predictions
- Inventory threshold alerts
- Performance anomaly detection
- Trend change notifications
- Optimization opportunity alerts
Product metrics are updated in real-time as transactions occur and inventory changes. Historical data enables trend analysis and forecasting for better inventory planning and product strategy decisions.