Track your business’s financial performance with real-time balance monitoring and revenue trend analysis.
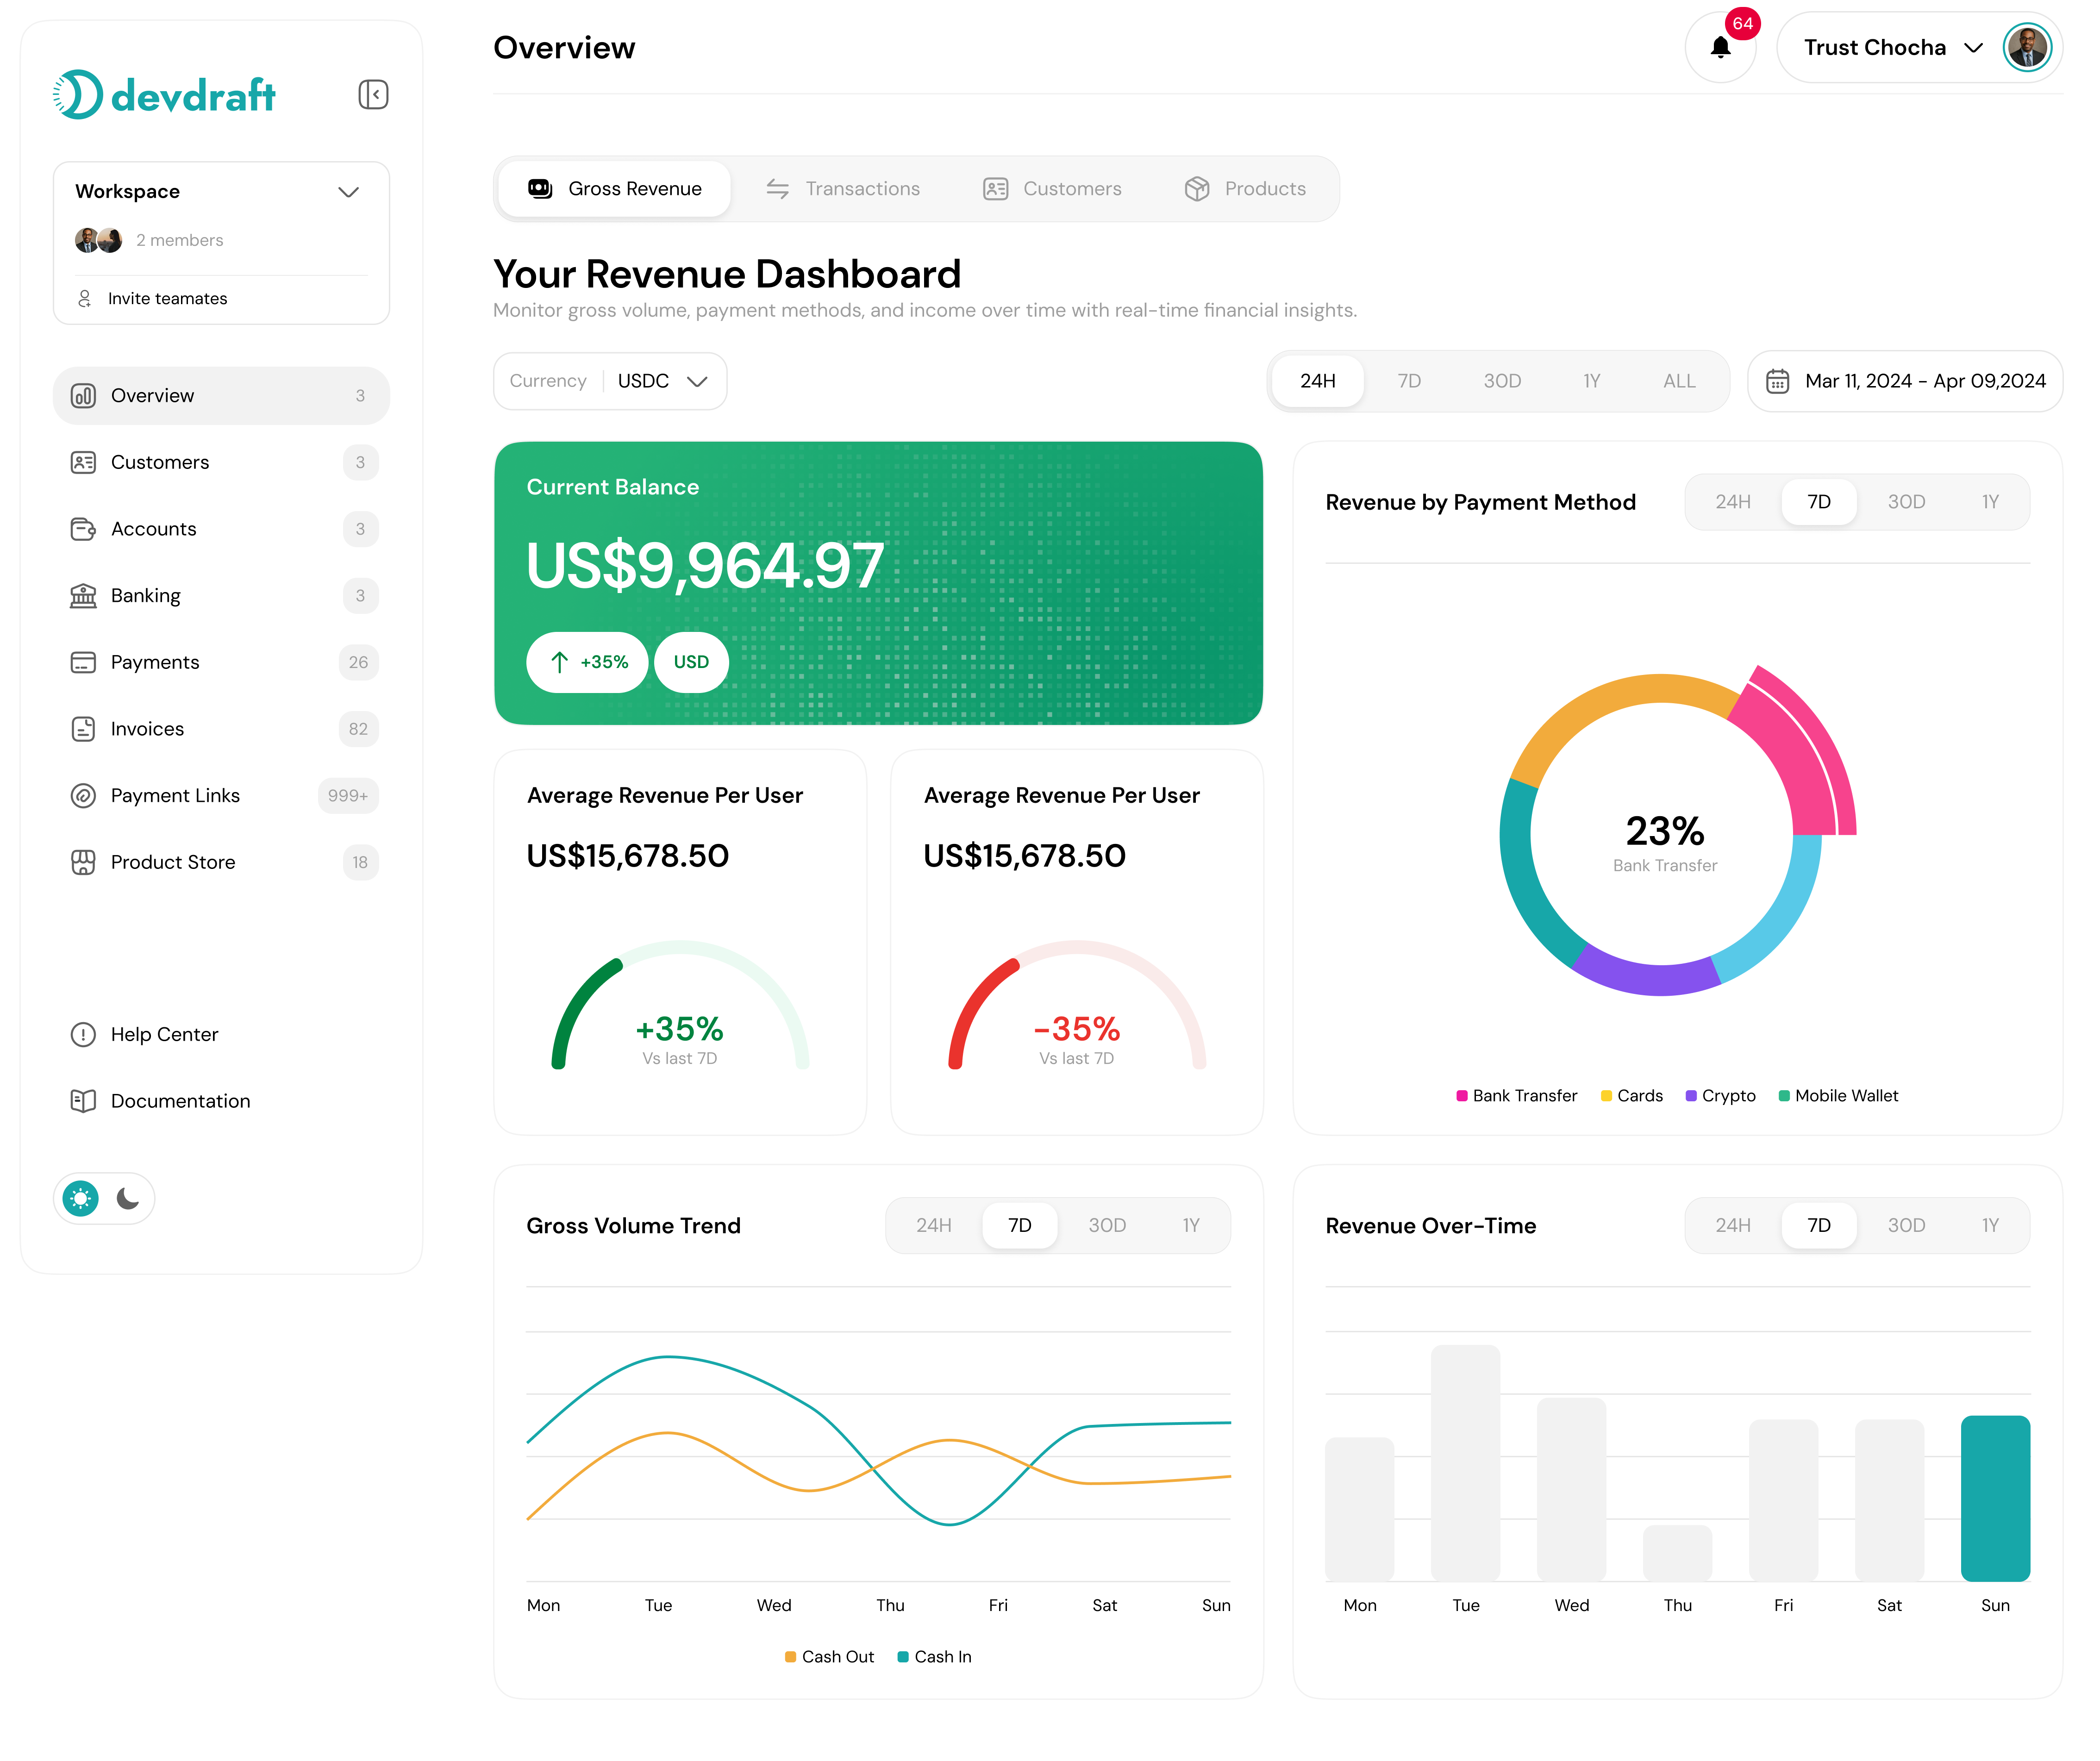
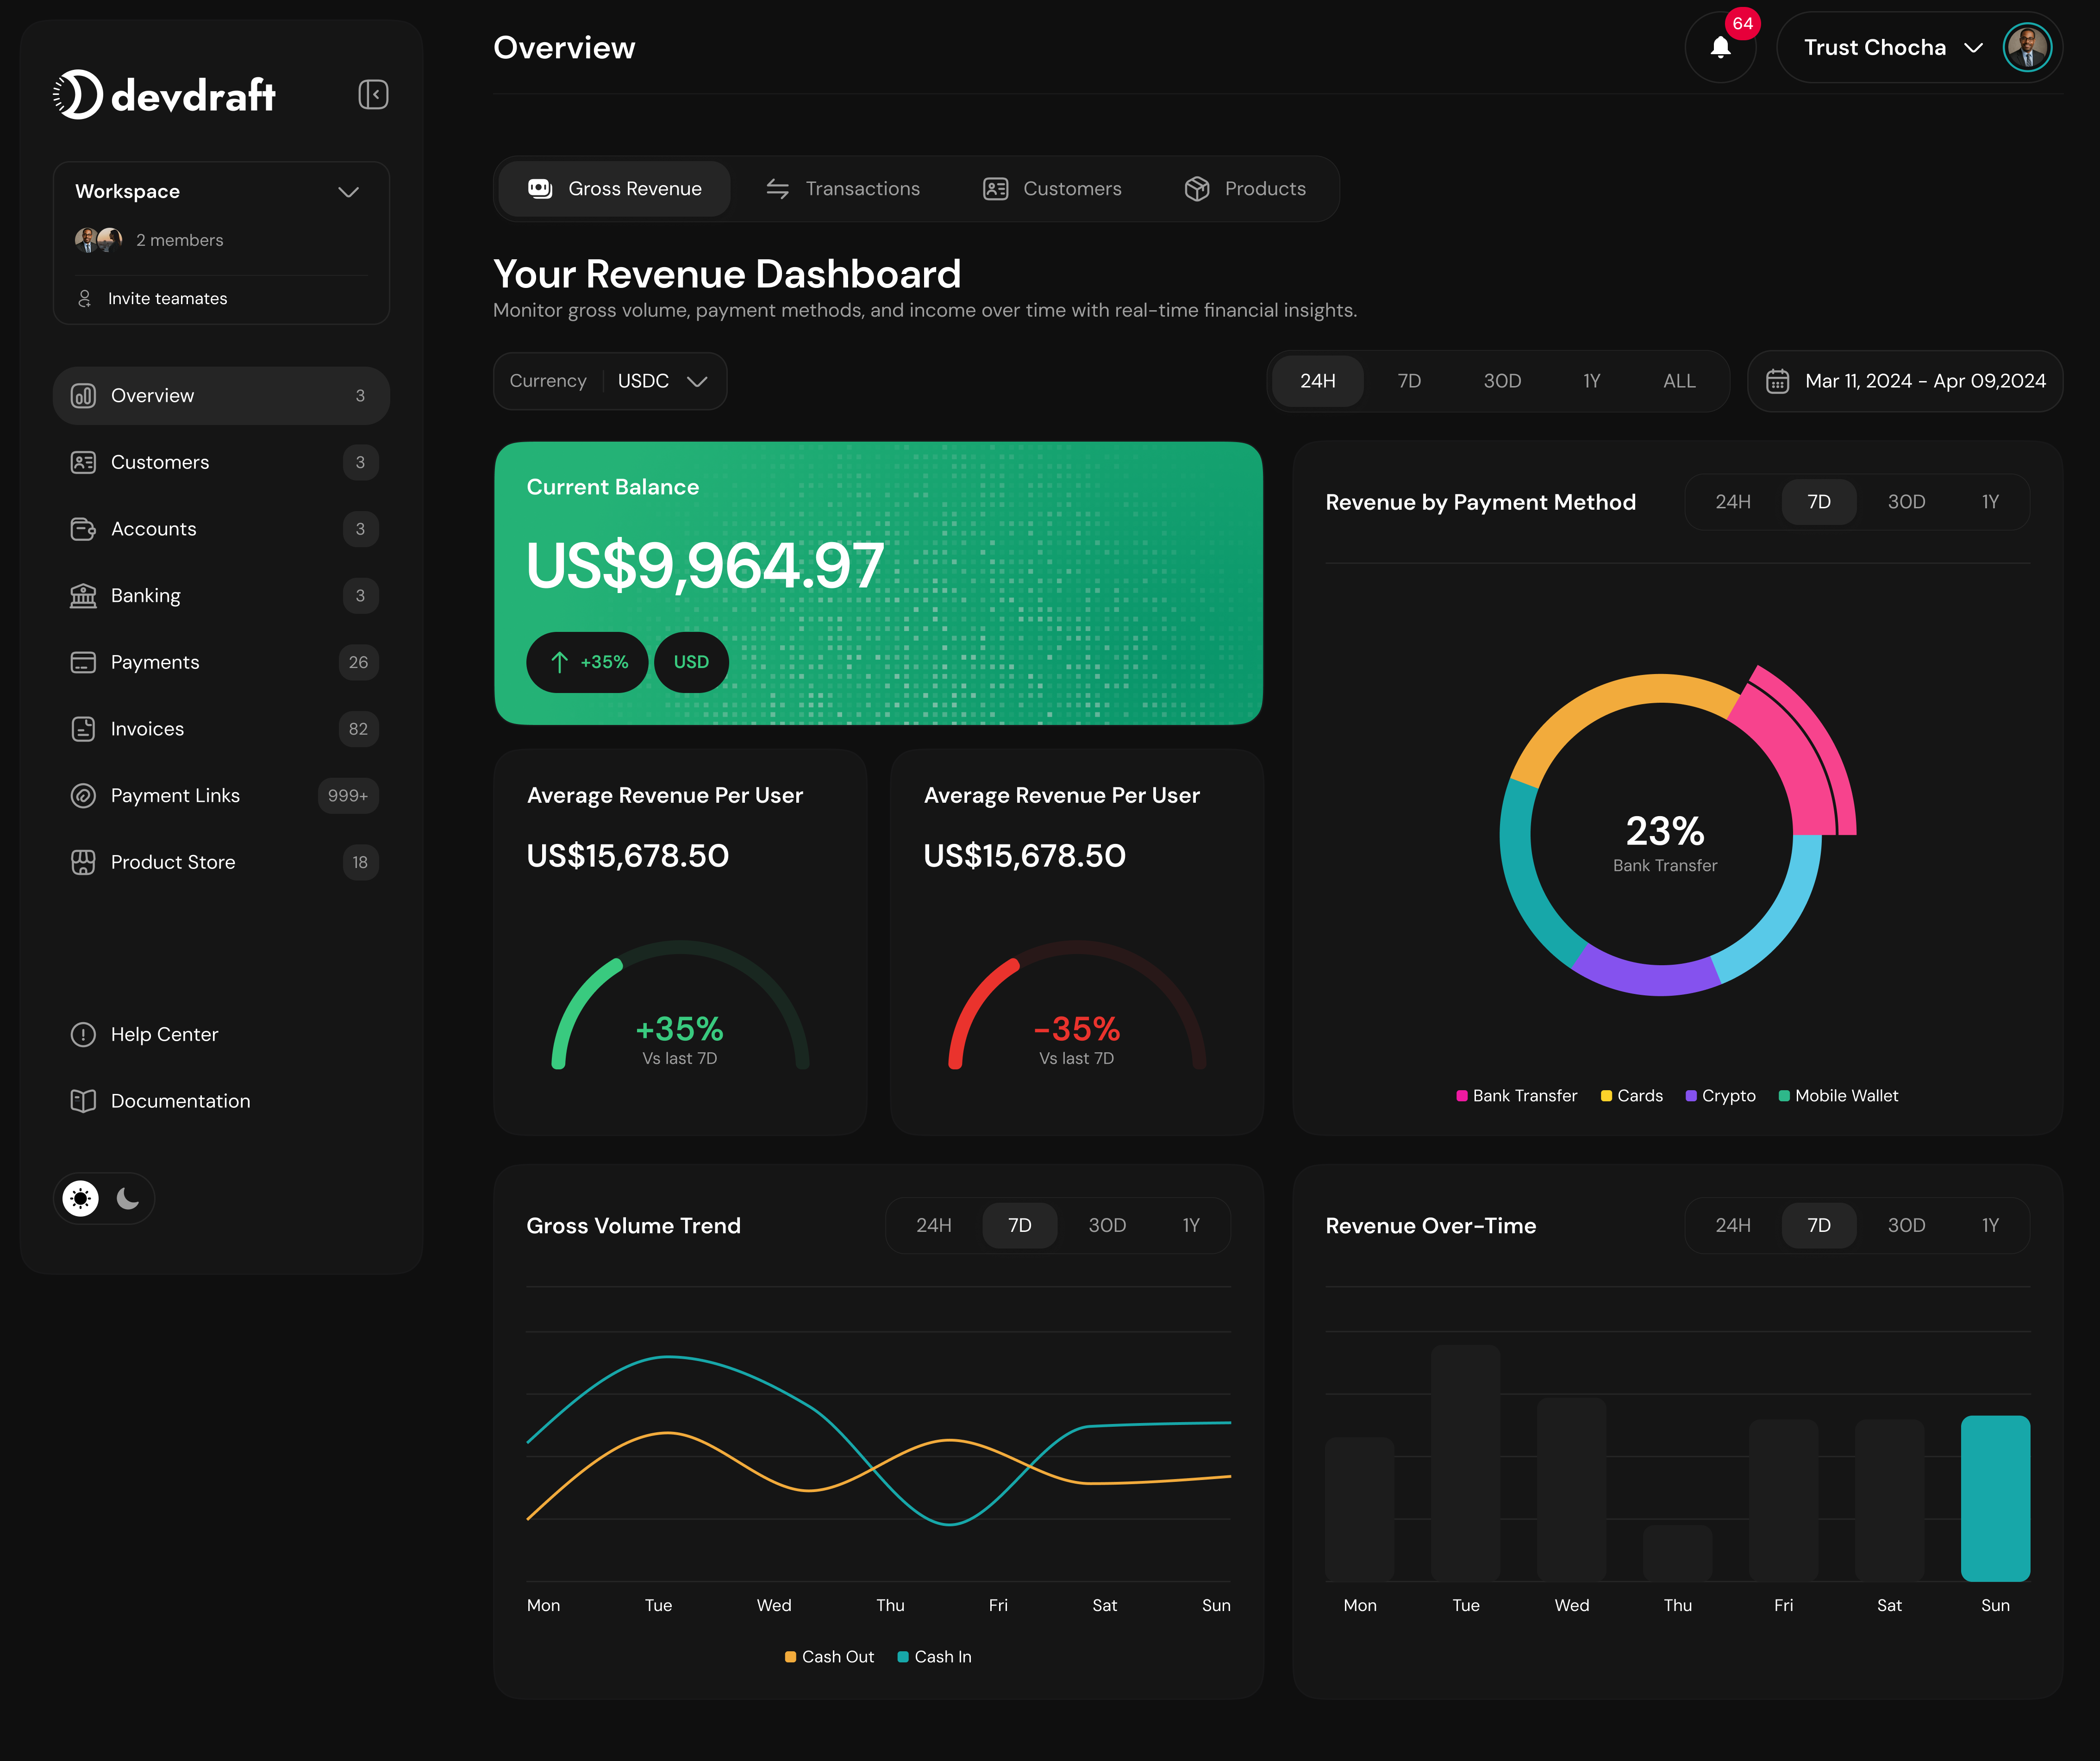
Gross Revenue Dashboard
Revenue Overview
Total Balance
Current Account Balance:
- Real-time USDC and EURC balances
- Available vs. actual balance tracking
- Multi-currency balance consolidation
- Balance history and trends
Gross Volume
Revenue Performance:
- Total revenue across all transactions
- Volume trends with percentage changes
- Period-over-period comparisons
- Currency-specific volume tracking
Revenue Analytics
Performance Insights:
- Revenue growth patterns
- Seasonal trend analysis
- Time-based revenue distribution
- Forecast projections
Revenue Tracking Features
- Balance Monitoring
- Revenue Trends
- Currency Analysis
Real-Time Balance Tracking:USDC Balance:
- Current available balance
- Pending transaction amounts
- Balance change notifications
- Historical balance trends
- Euro-denominated balance tracking
- Exchange rate impact analysis
- Regional revenue insights
- Cross-currency comparisons
Revenue Metrics Dashboard
Key Performance Indicators
Key Performance Indicators
Primary Revenue Metrics:Gross Volume:
- Total transaction volume processed
- Revenue growth rate (percentage change)
- Period-over-period comparisons
- Cumulative revenue tracking
- Current available balance
- Total account balance (including pending)
- Balance velocity (inflow vs. outflow)
- Average daily balance
- Revenue growth percentage
- Trend direction (positive/negative)
- Growth acceleration/deceleration
- Seasonal pattern recognition
Revenue Analytics Tools
Revenue Analytics Tools
Analysis Features:Time Period Analysis:
- Customizable date range selection
- Automatic period comparisons
- Trend line calculations
- Moving average indicators
- Transaction type revenue distribution
- Customer segment revenue analysis
- Product/service revenue attribution
- Geographic revenue mapping
- Revenue trend projections
- Growth rate predictions
- Seasonal adjustment factors
- Business planning insights
Interactive Charts
Interactive Charts
Visualization Options:Chart Types:
- Line Charts - Revenue trends over time
- Area Charts - Volume visualization with fill
- Bar Charts - Period-to-period comparisons
- Combination Charts - Multiple metrics overlay
- Interactive hover tooltips
- Zoom and pan functionality
- Data point drill-down
- Export capabilities (PNG, PDF, CSV)
- Time range selection
- Currency filtering
- Metric selection
- Display preferences
Revenue Filtering and Analysis
1
Select Time Range
Choose your analysis period from the time range selector:
- 24H for intraday analysis
- 7D for weekly trends
- 30D for monthly performance
- 1Y for annual overview
- All for complete history
2
Choose Currency
Filter revenue data by currency:
- USDC for USD-denominated revenue
- EURC for EUR-denominated revenue
- Combined for total revenue view
3
Analyze Trends
Review revenue patterns and growth:
- Identify peak revenue periods
- Spot seasonal trends
- Compare period-over-period performance
- Track growth acceleration
4
Export Data
Download revenue data for further analysis:
- CSV format for spreadsheet analysis
- PDF reports for presentations
- Chart images for documentation
Data Export and Reporting
Export Options
Export Options
Data Download Formats:CSV Export:
- Raw revenue data with timestamps
- Balance history records
- Transaction-level details
- Custom date range selection
- High-resolution PNG images
- Vector-based PDF charts
- Interactive HTML reports
- Presentation-ready formats
Automated Reporting
Automated Reporting
Scheduled Reports:Report Frequency:
- Daily balance summaries
- Weekly revenue reports
- Monthly performance analysis
- Quarterly business reviews
- Email report delivery
- Dashboard notifications
- API webhook integration
- Slack/Teams integration
Revenue metrics are updated in real-time as transactions are processed. Historical data is preserved for trend analysis and reporting purposes. Balance calculations include both available and pending amounts for complete financial visibility.